
Standard Deviation Calculator
Population and sample standard deviation, variance and mean of a data set.
Quick answer
- Population σ divides the squared deviations by n; sample s divides by n − 1 (Bessel's correction), so s is always slightly larger for the same data.
- Variance is the standard deviation squared — for the classic set 2, 4, 4, 4, 5, 5, 7, 9 the population variance is exactly 4 and σ is exactly 2.
- The deviation table shows every value's distance from the mean and its square, so you can audit the calculation line by line (capped at 12 values).
- Worked example — Mean: 5.00 (full example below).
Standard Deviation Calculator
| Mean | 5.00 |
| Population standard deviation (σ) | 2.00 |
| Sample standard deviation (s) | 2.14 |
| Population variance | 4.00 |
| Sample variance | 4.57 |
| Count | 8 |
| Deviation table | 2: 2−5 = -3, (2−5)² = 9 · 4: 4−5 = -1, (4−5)² = 1 · 4: 4−5 = -1, (4−5)² = 1 · 4: 4−5 = -1, (4−5)² = 1 · 5: 5−5 = 0, (5−5)² = 0 · 5: 5−5 = 0, (5−5)² = 0 · 7: 7−5 = 2, (7−5)² = 4 · 9: 9−5 = 4, (9−5)² = 16 |
This classic textbook data set has a mean of 5, a population variance of exactly 4 and a population standard deviation of exactly 2. As a sample, the variance is about 4.57 and the standard deviation about 2.14.
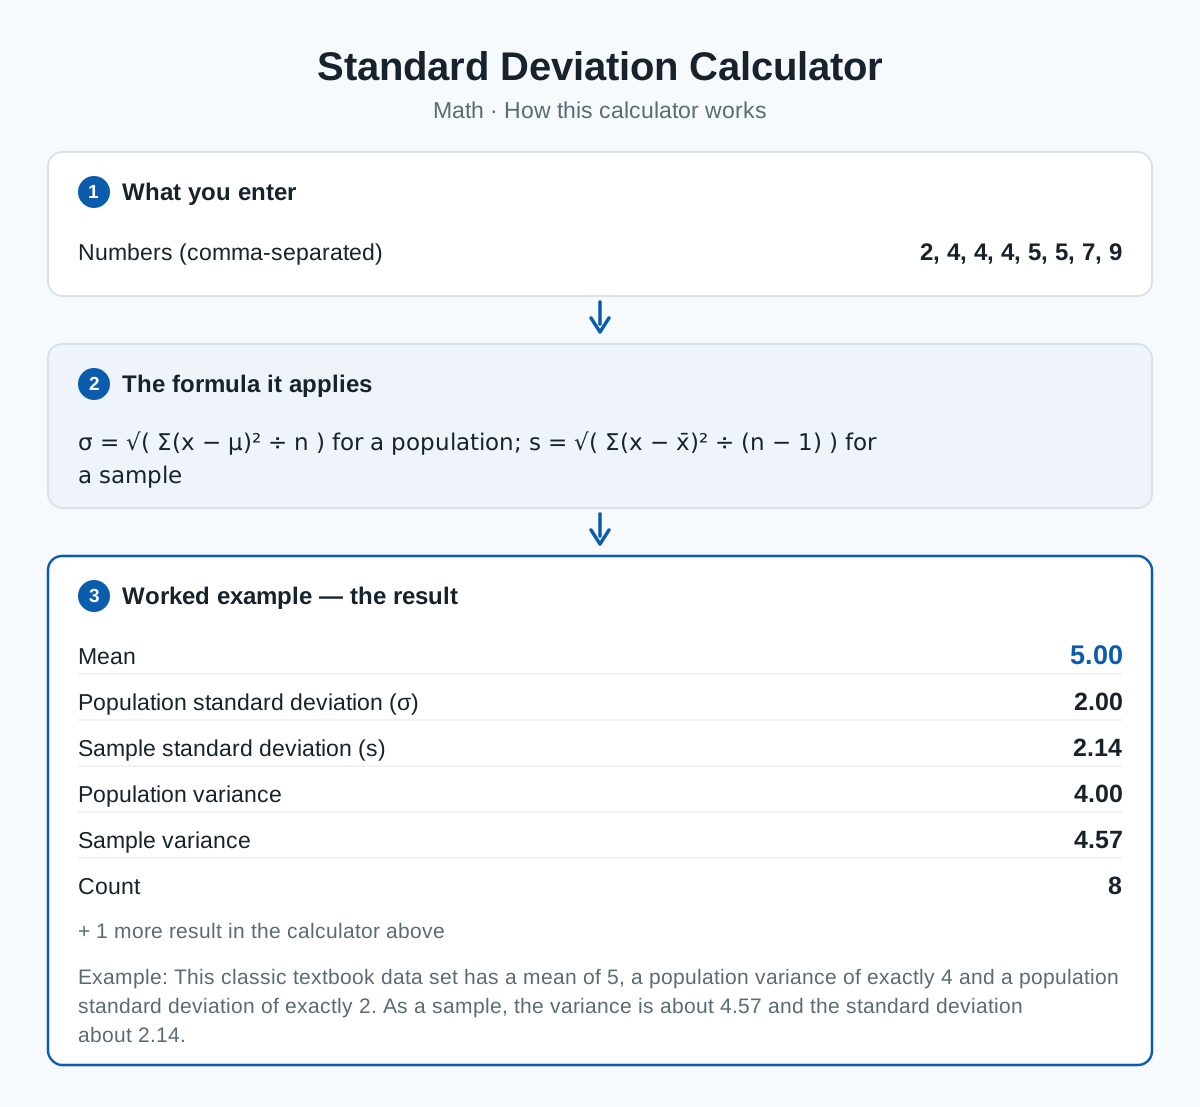
Standard deviation measures how spread out numbers are around their mean. A small standard deviation means the values cluster tightly; a large one means they are scattered widely. Variance is simply the standard deviation squared.
Enter a comma-separated list. Both versions are shown: population standard deviation (your list is the complete set) and sample standard deviation (your list is a sample of a larger group, which divides by n − 1 instead of n and gives a slightly larger value).
The formula
Worked example
This classic textbook data set has a mean of 5, a population variance of exactly 4 and a population standard deviation of exactly 2. As a sample, the variance is about 4.57 and the standard deviation about 2.14.
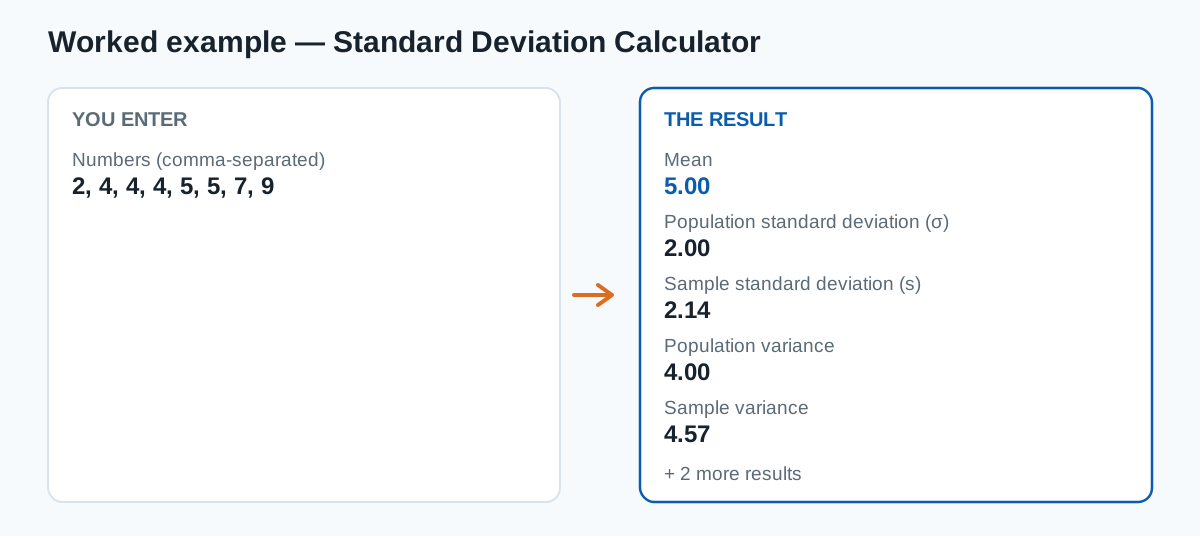
The example is pre-loaded in the result panel — press Calculate with your own numbers to replace it.
Frequently asked questions
Should I use population or sample standard deviation?
Use the population version when your list is everything you care about (all 20 students in a class). Use the sample version when your list is a subset used to estimate a bigger group (20 students sampled from a whole school).
What does a standard deviation of zero mean?
Every value is identical, so there is no spread at all. A list like 10, 10, 10 has a standard deviation and variance of 0.
Why square the differences?
Squaring makes positive and negative deviations both count positively and gives extra weight to values far from the mean. Taking the square root at the end brings the result back into the original units.
Why does the sample standard deviation divide by n − 1 instead of n (Bessel's correction)?
Because a sample's deviations are measured from the sample mean, not the true population mean — and the sample mean is itself estimated from the same data, which makes the deviations systematically a little too small (they always sum to zero, so only n − 1 of them are free to vary). Dividing by n − 1 instead of n inflates the result just enough to cancel that bias, making the sample variance an unbiased estimator of the population variance. That is also why the sample standard deviation is always slightly larger than the population one for the same numbers.
Category: Math calculators
Sources & methodology
Deviations in the deviation table are taken against the population mean μ. Population variance averages the squared deviations over n; sample variance divides by n − 1 (Bessel's correction) to unbiasedly estimate the population variance from a sample.
Content last reviewed by CalcHub Editorial.
Embed this calculator on your site
Free to use with attribution — paste the snippet below and the calculator appears on your page, with a link back to CalcHub.
Related calculators
Mean, Median & Mode Calculator
Mean, median, mode and range of a list of numbers in one go.
Average Calculator
Mean of a list of numbers, with the sum and count shown.
Probability Calculator
Probability as a percentage, decimal and '1 in X' odds.
Percentage Calculator
Find X% of a number, or work out what percent one number is of another.