Why BMI Can Be Misleading: Muscle, Age, and What to Check Instead
The number that can label a fit athlete "obese"
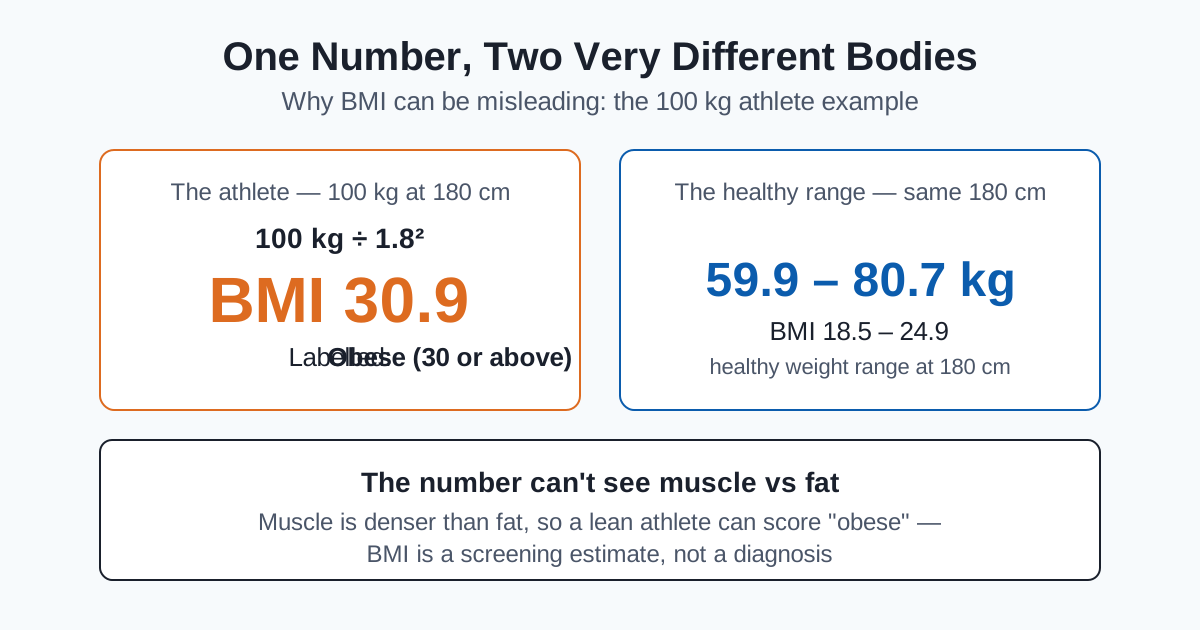
Body mass index was designed as a population screening tool — a fast, cheap way to compare weight against height across thousands of people. For that job, it works well. The problem starts when the same single number is treated as a verdict on one specific person. A 100 kg athlete carrying lean muscle can get a BMI of 30.9 and land in the "obese" category, while a sedentary person with very little muscle can sit comfortably inside "normal weight" with far worse body composition. This article walks through exactly why BMI can be misleading, works the athlete example with the site's own calculator numbers, and shows what to check alongside BMI so you get the full picture. For the full how-it's-calculated walkthrough and the category table, see our BMI explained guide; this article is the limitations deep-dive.
The direct answer
BMI = weight (kg) ÷ height (m)². That is all it is: one weight divided by height squared. The formula has no input for muscle mass, body fat, age-related muscle loss, or where fat is carried — so it cannot distinguish muscle from fat. Two people with the same height and weight always get the same BMI, even if one is an athlete and the other is sedentary.
The adult categories our BMI calculator applies are:
| Category | BMI range |
|---|---|
| Underweight | Below 18.5 |
| Normal weight | 18.5–24.9 |
| Overweight | 25–29.9 |
| Obesity | 30 or above |
These are the standard adult cut-offs — the same ones used by public health agencies such as the CDC's BMI resource, which describes BMI as a screening measure, not a diagnostic tool. Children and teens are not assessed with these cut-offs at all; they use age- and sex-specific percentiles instead. One important note before the worked example: BMI is a screening estimate, not medical advice. If your result worries you, discuss it with a clinician rather than diagnosing from the number alone.
Worked example: the 100 kg athlete who scores "obese"
Take a muscular athlete who weighs 100 kg and is 180 cm tall — the kind of build that comes from years of heavy training, low visible body fat, and dense muscle. Here is the calculation step by step:
Step 1: Convert height to metres. 180 cm = 1.8 m.
Step 2: Square the height. 1.8 × 1.8 = 3.24.
Step 3: Divide the weight by the squared height. 100 ÷ 3.24 = 30.9.
BMI = 100 ÷ 1.8² = 30.9 → "Obese (30 or above)"
Read that again: a lean, visibly muscular athlete is labelled obese by this number. Muscle is denser than fat, and the formula cannot see which of the two is making up those 100 kg. Run the same numbers yourself in the BMI calculator — the result is the same.
The contrast: same height, a healthy-weight BMI
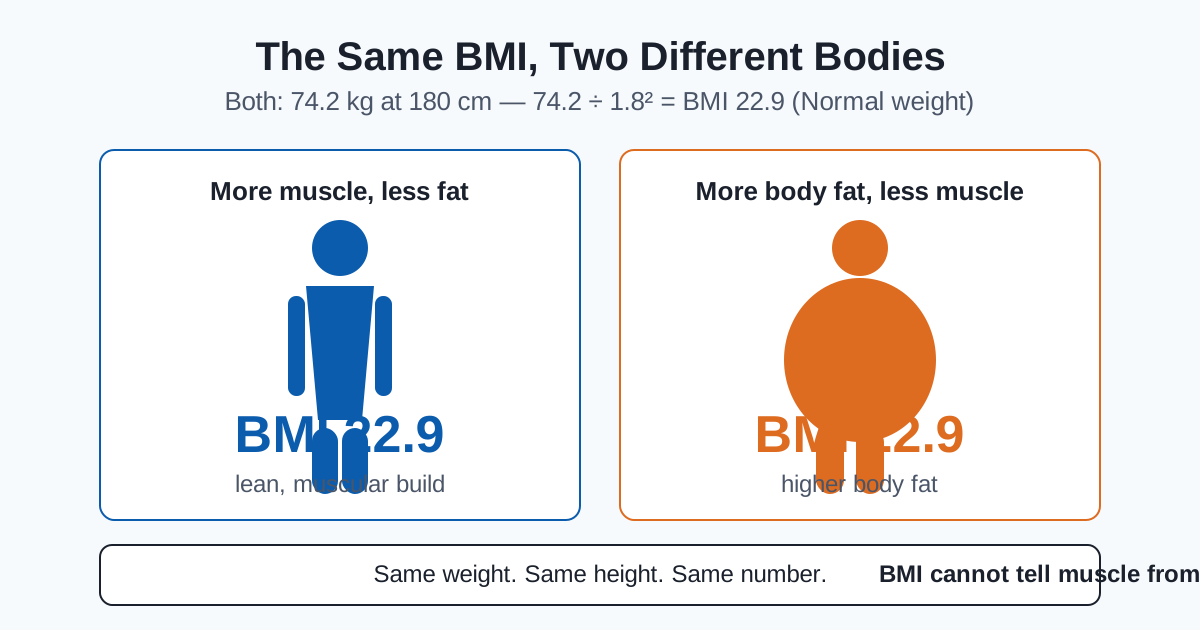
Now put a second person at the same 180 cm, this time weighing 74.2 kg:
BMI = 74.2 ÷ 1.8² = 74.2 ÷ 3.24 = 22.9 → "Normal weight (18.5–24.9)"
At 180 cm, the healthy-weight band of BMI 18.5 to 24.9 corresponds to 59.9 kg to 80.7 kg (18.5 × 3.24 = 59.9; 24.9 × 3.24 = 80.7). Our 74.2 kg example sits comfortably inside it. But the figure below shows why even a "normal" result deserves a second look: the same BMI of 22.9 could belong to a lean muscular body or to one with higher body fat and less muscle. The number is identical; the health picture may not be.
Who BMI misleads most
For most average-built adults, BMI correlates reasonably well with body fat. It starts to mislead in specific, predictable groups:
Athletes and muscular builds. Strength athletes, rugby players, sprinters, and anyone with above-average muscle mass can land in "overweight" or even "obese" while being very lean — the 100 kg athlete at 30.9 is the classic case. For them, BMI overstates body fat.
Older adults with low muscle mass. Muscle mass tends to decline with age. An older adult can lose muscle and gain fat while the scale — and therefore the BMI — barely moves. Here BMI understates body fat: a "normal" 23 can belong to someone with the low muscle mass and high fat of the higher-risk category this article covers as sarcopenic obesity territory.
Very short or very tall people. The formula divides by height squared, which is only an approximation of how bodies scale. At the extremes of height, the approximation bends — two people of proportional build at very different heights can get meaningfully different BMIs. For children and teens, the issue is bigger still: growing bodies are assessed with age- and sex-specific percentile charts, never with the adult cut-offs in the table above.
What to check instead of BMI alone
BMI is a starting point, not a verdict. These are the checks that fill in what the number misses:
Waist circumference. Fat carried around the middle is the type most strongly associated with metabolic risk, and a tape measure catches it directly. A waist above about 94 cm (37 in) for men or 80 cm (31.5 in) for women is the commonly cited raised-risk threshold — it measures what BMI ignores.
Body fat percentage. This is the direct answer to the question BMI can't handle: how much of your weight is fat? Our body fat calculator estimates it from simple measurements, so you can see whether a high BMI comes from muscle or from fat — the distinction the athlete example turns on.
Your healthy weight range. If your BMI is outside the normal band, the useful follow-up is "what range should I be in?" The ideal weight calculator gives the healthy weight range for your exact height — the same 59.9–80.7 kg band shown above for 180 cm — as a concrete target instead of an abstract category label.
Your energy needs. Weight goals only work if you know what you're eating and burning. The BMR calculator estimates your basal metabolic rate, the baseline for planning any sustainable weight change.
And if you want the full foundations — how the formula works, what each category means, and where the cut-offs come from — the BMI explained guide covers calculation, categories, and limits in one place. That guide is the companion reference; this article is the deep-dive into why the number can mislead.
Common mistakes
Treating the category as a diagnosis. "Obese" on a BMI result is not a medical diagnosis of obesity — it is a screening flag. Public health bodies describe BMI as a screening measure precisely because of the muscle-vs-fat blind spot. The label is a reason to look further, not a verdict.
Applying adult cut-offs to children. The underweight / normal / overweight / obesity bands in this article apply to adults aged 20 and over. For children and teens, BMI is interpreted as a percentile for age and sex on a growth chart — an 85th-percentile teen and an 85th-percentile 8-year-old mean different things, and the adult cut-offs mean nothing for either.
Comparing BMIs across very different builds. A 30.9 in a muscular rugby player and a 30.9 in a sedentary desk worker are the same number and completely different health pictures. Comparing the two raw BMIs tells you nothing that body fat percentage and waist circumference wouldn't tell you better.
Frequently asked questions
Why is my BMI "obese" if I'm muscular?
Because BMI only sees total weight and height, not what the weight is made of. Muscle is denser than fat, so a muscular 100 kg at 180 cm scores 30.9 — "Obese (30 or above)" — even with low body fat. The formula = weight ÷ height² cannot tell the difference; a body fat estimate can.
Is BMI useless then?
No — it's just narrow. BMI remains a cheap, standardised screening tool that works reasonably well across large populations and for average-built adults. Its limits appear at the individual level, especially for athletes, older adults with low muscle mass, and very short or tall people. Treat it as a first screen, not the whole assessment.
What BMI is healthy?
For adults, the normal-weight category is 18.5–24.9. At 180 cm, that band corresponds to 59.9–80.7 kg. But "healthy" isn't a single BMI value — a lean 22.9 and a low-muscle 22.9 are different bodies, which is why body fat and waist circumference belong in the picture too.
Does BMI work for children?
Not with these cut-offs. Children and teens are assessed with BMI-for-age-and-sex percentiles on growth charts, because bodies change so fast during growth. The adult categories (underweight / normal / overweight / obesity with fixed BMI numbers) do not apply to them.
What should I measure instead of BMI?
Use BMI as the starting screen, then add: waist circumference (a tape measure), body fat percentage (via the body fat calculator), and your healthy weight range for your height (via the ideal weight calculator). Together they answer what BMI alone can't.
Can two people with the same BMI have different health risks?
Yes — that's the core of why BMI can be misleading. The worked example shows it twice: a lean 100 kg athlete scoring "obese" at 30.9, and a BMI of 22.9 belonging to either a muscular or a higher-fat body. Same number, different composition, different picture.
Conclusion: screen with the number, judge with the context
BMI is a useful screen that breaks down exactly where it matters most: the individual. A 100 kg athlete at 180 cm scores 30.9 — "obese" — because the formula counts muscle and fat as the same thing. Use the number for what it is, then check waist circumference, body fat percentage, and your height's healthy weight range before drawing any conclusion. And remember: a screening result is not medical advice — if it worries you, a clinician is the right next stop.
Your next step: run your own numbers in the BMI calculator, then check your body fat percentage to see what your number is actually made of.